ESG Core Equity*

Invests across the range of market capitalizations and economic sectors in companies that meet Trillium’s sustainability criteria.

Invests across the range of market capitalizations and economic sectors in companies that meet Trillium’s sustainability criteria.

Investment Process

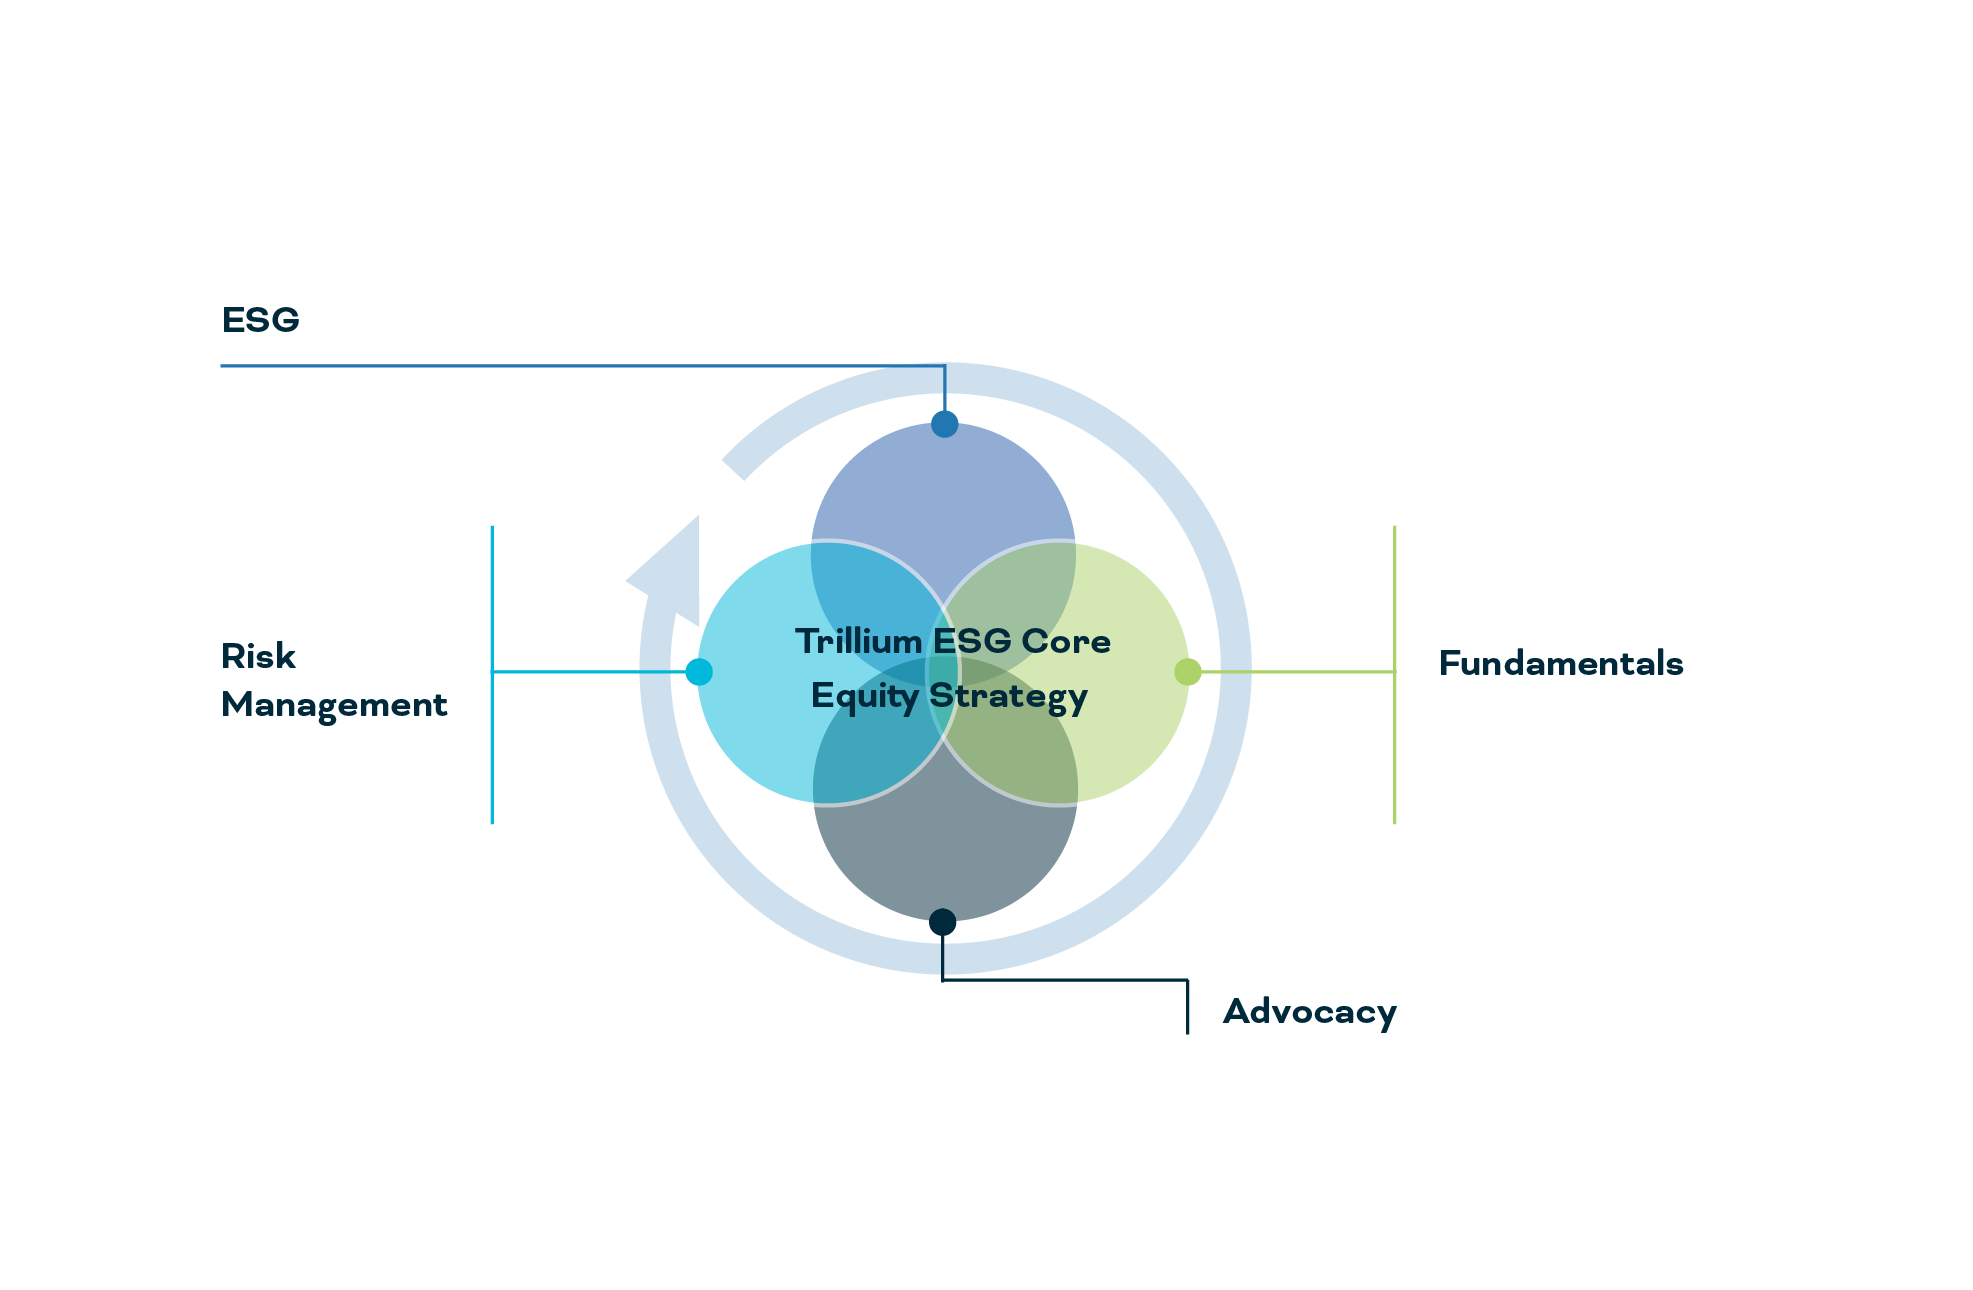
Fundamental equity analysts, who divide coverage by sector, are responsible for providing in-depth analysis of companies and generating new buy ideas consistent with the strategy’s high quality approach, including a rigorous integrated review of financial and ESG factors. The Investment Management Committee, comprised of portfolio managers and analysts, meets periodically to review and approve recommendations to the buy-list recommended by the analysts. A strategy team, headed by the lead Portfolio Manager, rebalances the portfolio on at least a quarterly basis to identify the best subset of names from the buy-list at that particular point of time. The team leverages an optimization process that helps monitor and control portfolio characteristic exposures while overweighting companies based on a proprietary alpha score that includes an analyst rating. In this sense, the strategy is fundamentally driven, but quantitatively assisted.

Contact Information

Tom Simunovic
Tom Simunovic
ESG Investment Strategy Specialist and Relationship Manager
tsimunovic@trilliuminvest.com617-532-6673

Portfolio Managers

Elizabeth Levy, CFA
Elizabeth Levy, CFA
Lead Portfolio Manager
Bio >
Laura McGonagle, CFA
Mitali Prasad, CFA
Portfolio Manager
Bio >
Cheryl Smith, CFA, PhD
Portfolio Manager
Bio >
Benchmark
S&P 1500
Inception Date
1994
Strategy Assets*
$1.1b
Holdings
65-80
% Top 10 Holdings
34.05%
Initial Position Size
0-5%
Target Tracking Error
3-4%
Sector Deviation +/-
<5%
Annual Turnover
20-40%
Vehicle Type
Separate Account**
* Strategy Assets are supplemental

** Traditional separately managed accounts as well as model delivery through intermediary partnerships.
Equity Characteristics
as of 3/31/24
ESG Core EQUITY
S&P 1500
Market Capitalization
(weighted avg. billions)
$620.95
$739.10
P/E (FTM EST)
22.9x
20.7x
Price/Book
5.4x
4.2x
Est. 3-5 Yr. EPS Growth
14.55%
12.76%
ROIC
20.94%
19.87%
LT Debt/Capital
37.67%
40.29%
Sector Allocation vs. Benchmark
as of 3/31/24
ESG Core EQUITY
S&P 1500
Information Technology
27.9%
28.0%
Health Care
13.6%
12.1%
Financials
12.0%
13.4%
Consumer Discretionary
11.4%
10.8%
Industrials
11.1%
9.8%
Consumer Staples
7.6%
5.8%
Communication Services
5.9%
8.4%
Materials
4.4%
2.7%
Real Estate
4.0%
2.7%
Utilities
2.1%
2.3%
Energy
0.0%
4.1%
Sector Allocation, Equity Characteristics and Top Holdings based on a representative account as of 3/31/2024 and exclude cash.
As of 3/31/2024
QTR
YTD
1 Year
3 Year
5 Year
10 Year
Inception
(1/1/2007)
Gross of Fees
8.1%
8.1%
20.1%
7.0%
11.9%
10.3%
9.2%
Net of Fees
7.8%
7.8%
18.3%
5.4%
10.2%
8.7%
7.8%
S&P 1500
10.3%
10.3%
29.2%
11.0%
14.7%
12.7%
10.0%
Annualized time-weighted returns for ESG Core Equity composite through 3/31/2024. Time periods less than one year are not annualized. The ESG Core Equity Composite was created on September 14, 2011 and has an inception date of January 1, 2007. Composite Assets are $304.2 million as of 3/31/2024. Past performance is no guarantee of future results.  Every investment carries the potential for both profit and loss.  IMPORTANT: Please see important performance disclosures below.